The Short Answer: $250,000 to $500,000 Per Year
The average active food truck in the U.S. generates between $250,000 and $500,000 in gross annual revenue. That is a wide range because "food truck" covers everything from a taco window doing weekday lunches to a fully branded catering operation running 5-6 events per week.
Your actual revenue depends on three things: how often you operate, what you charge, and where you park. A truck doing 200 events per year at $1,500 average revenue hits $300,000. A truck doing 250 events at $2,500 average revenue hits $625,000. The math is simple. The execution is not.
This guide breaks down food truck income by event type, walks through real margins, and gives you the numbers you need to forecast your own revenue.
Quick Facts (2026)
| Metric | Value |
|---|---|
| Median food truck annual revenue | $350,000 |
| Range, established trucks | $250,000-$500,000 |
| First-year truck revenue (typical) | 40-60% of median |
| Average ticket price | $10-$16 (median $13) |
| Peak-season monthly revenue | $25,000-$50,000 |
| Off-season monthly revenue | $10,000-$25,000 |
| Net margin (well-run) | 15-30% annual, 25-45% per event |
| Owner take-home (typical) | $50,000-$90,000 |
Revenue by Event Type
Not all events pay the same. Here is what food truck operators typically report across different event types.
Farmers Markets and Weekly Markets
- Average revenue per event: $500 - $1,500
- Frequency: 1-3 per week, seasonal
- Annual potential (markets only): $25,000 - $75,000
Markets are consistent but rarely high-dollar. You build a regular customer base, which has long-term value, but the per-event revenue is modest. Best for trucks that supplement markets with other event types.
Festivals and Large Events
- Average revenue per event: $2,000 - $10,000+
- Frequency: 2-8 per month during peak season
- Annual potential (festivals only): $40,000 - $150,000
Festivals are where food trucks can earn serious money in a single weekend. A strong truck at a well-attended 3-day festival can clear $8,000-$15,000 in gross revenue. The catch: festival fees ($500-$2,000+), long hours, and seasonal availability. Most festival seasons run April through October.
Corporate and Private Catering
- Average revenue per event: $1,500 - $5,000
- Frequency: 2-6 per month
- Annual potential (catering only): $36,000 - $180,000
Catering is the highest-margin event type for most trucks. You negotiate a flat rate or per-head price, often with a guaranteed minimum. No foot traffic risk. Prep is predictable. Corporate lunch catering ($15-$25 per head for 50-200 people) is especially lucrative and repeatable.
Lunch Routes and Daily Spots
Your next steps
Most operators tackle these right alongside the permit. Each takes a few minutes and gets you closer to opening day.
Finance your truck or equipment
Trucks run $30k to $175k. Compare equipment and working-capital options, with a soft check to start.
See financing optionsAffiliate partner. PitStop may earn a commission at no extra cost to you.
Form your LLC
Set up the LLC most operators file for liability protection. A few minutes, often under $100 plus state fees.
Start your LLCAffiliate partner. PitStop may earn a commission at no extra cost to you.
Some of these are affiliate partners, so PitStop may earn a commission at no extra cost to you. We only list options we would point a real operator to. How this works.
- Average revenue per event: $400 - $1,200
- Frequency: 4-5 per week
- Annual potential (lunch only): $80,000 - $250,000
Daily lunch service is the bread-and-butter (literally) for many trucks. Revenue per stop is lower, but consistency adds up. A truck averaging $800/day over 250 working days generates $200,000 in gross revenue from lunch alone.
Brewery and Taproom Partnerships
Are your events actually profitable?
Log every event, track real costs, and see your actual profit per gig so you stop guessing and start booking smarter. Free to start.
- Average revenue per event: $600 - $2,000
- Frequency: 2-4 per week
- Annual potential: $60,000 - $200,000
Brewery gigs are increasingly common and reliable. The brewery provides the crowd, you provide the food. Some trucks rotate between 3-5 breweries weekly and build it into a full schedule.
What Affects Your Revenue the Most
Location and Market Size
A food truck in Austin, Portland, or Los Angeles has access to more events, higher price tolerance, and year-round operating seasons. A truck in a smaller market may max out at $200,000/year simply because there are fewer events to book.
Menu and Average Ticket Price
Your average ticket price is the single biggest lever on revenue. The difference between a $10 average ticket and a $14 average ticket, over 200 events serving 100 customers each, is $80,000 per year.
| Average Ticket | Customers/Event | Events/Year | Annual Revenue |
|---|---|---|---|
| $10 | 100 | 200 | $200,000 |
| $12 | 100 | 200 | $240,000 |
| $14 | 100 | 200 | $280,000 |
| $16 | 100 | 200 | $320,000 |
Operating Schedule
Revenue scales directly with how many events you work. Most trucks operate 150-250 events per year. Below 150 and you are likely not covering fixed costs. Above 250 and you are running hard without breaks.
Seasonality
In most U.S. markets, food truck revenue drops 30-50% during winter months (November through February). Smart operators offset this with catering, indoor events, and commissary-based delivery. Build your annual budget around 8-9 strong months and 3-4 slow ones.
Real Profit Margins: What You Actually Keep
Gross revenue is not your income. Here is how the money actually breaks down for a typical food truck generating $350,000/year.
| Category | Percentage | Annual Amount |
|---|---|---|
| Food costs | 30-35% | $105,000 - $122,500 |
| Labor (including owner) | 20-30% | $70,000 - $105,000 |
| Fuel and vehicle costs | 5-8% | $17,500 - $28,000 |
| Event fees and permits | 3-7% | $10,500 - $24,500 |
| Insurance | 2-3% | $7,000 - $10,500 |
| Commissary and supplies | 2-4% | $7,000 - $14,000 |
| Credit card processing | 2-3% | $7,000 - $10,500 |
| Marketing and branding | 1-2% | $3,500 - $7,000 |
| Net profit | 25-35% | $87,500 - $122,500 |
Food truck operators are discussing this
Lake Eola farmers market -- steady but not spectacular
Bilingual menus increased my average ticket by $3
Portland Saturday Market -- love/hate relationship
That 25-35% net margin is realistic for a well-run truck. Some operators report margins as high as 40-45% on individual events, especially catering gigs with negotiated pricing.
Owner Take-Home Pay
Here is where it gets real. "Profit" and "owner salary" are not the same thing unless you are a solo operator.
- Solo operator (no employees): Your take-home is the full net profit minus taxes. On $350,000 revenue with 30% margins, that is roughly $105,000 before taxes, or about $75,000-$85,000 after self-employment tax and income tax.
- Owner with 1-2 employees: You pay yourself a salary from the labor line ($40,000-$60,000) plus whatever net profit remains. Total compensation: $60,000-$100,000.
- Owner with a full crew: Your salary comes from the labor budget. Profit is what the business retains for growth, truck maintenance, and reserves. Owner take-home: $50,000-$80,000.
The median food truck owner earns between $50,000 and $90,000 per year. Top operators in strong markets with multiple revenue streams (events + catering + merchandise) report $100,000-$150,000+.
Food Truck vs. Restaurant Economics
Why do food trucks often outperform restaurants on margins?
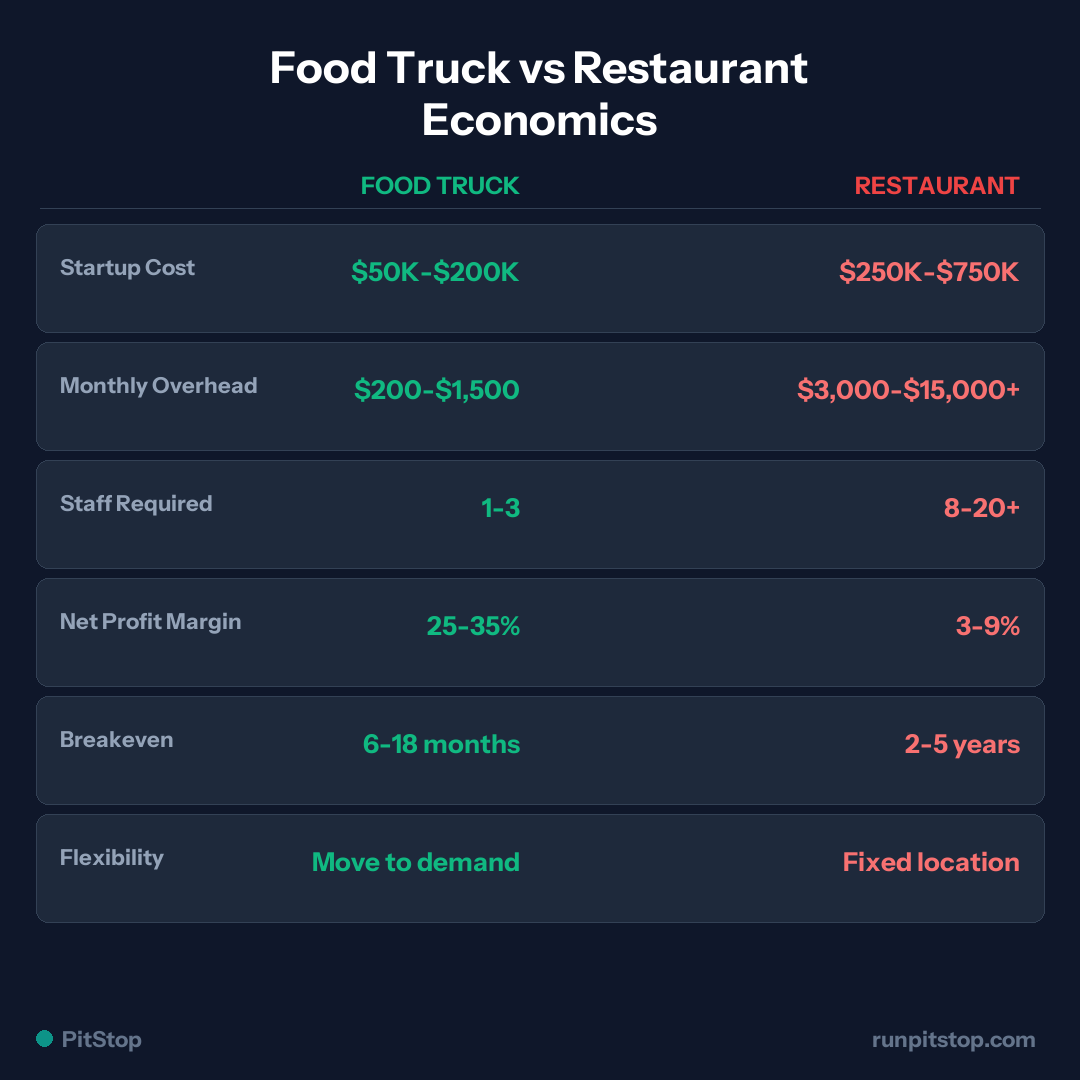
| Factor | Food Truck | Restaurant |
|---|---|---|
| Startup cost | $50K-$200K | $250K-$750K |
| Monthly rent/overhead | $200-$1,500 (commissary) | $3,000-$15,000+ |
| Staff required | 1-3 | 8-20+ |
| Net profit margin | 25-35% | 3-9% |
| Breakeven timeline | 6-18 months | 2-5 years |
| Flexibility | Move to the demand | Fixed location |
The average restaurant operates on a 3-9% net margin. Food trucks run at 25-35%. The tradeoff is scale: a successful restaurant generates more total revenue, but a food truck keeps more of every dollar it earns.
How to Forecast Your Own Revenue
Stop guessing. Use real numbers from your first few events and project forward.
Use the PitStop Food Truck Calculator to plug in your numbers and see projected monthly and annual revenue based on your actual event data.
The Bottom Line
Food trucks make real money. $250,000-$500,000 in annual revenue is achievable for an active truck in a decent market. After all expenses, owners typically take home $50,000-$90,000, with top operators clearing six figures.
But these numbers only matter if you track them. The trucks that hit the high end of these ranges are the ones that know their cost per event, their real margins, and which events are worth their time.
Track your real numbers with PitStop - free for 10 events/month. See your actual revenue, margins, and per-event profitability in one dashboard.