The Real Number: 25% to 45% Per Event
Most well-run food trucks operate at a 25-45% profit margin per event. That means for every $1,000 in revenue, you keep $250 to $450 after all direct costs.
But that range is enormous, and where you land depends on factors you control: your food cost percentage, your labor structure, which events you work, and how disciplined you are about tracking expenses.
This guide breaks down what goes into food truck profitability, gives you benchmarks to measure against, and shows you how to push your margins toward the high end.
What "Profit Margin" Actually Means for Food Trucks
First, let us be precise. There are three ways to think about food truck profit, and they tell you different things.
Per-Event Profit Margin
This is revenue minus all direct costs for a single event: food, labor, event fees, fuel to get there, and credit card processing fees.
Formula: (Revenue - Food Cost - Labor - Event Fee - Fuel - Card Fees) / Revenue
Healthy range: 30-45%
This is the most actionable number because it tells you whether a specific event is worth doing. Use the PitStop Calculator to run this for every event.
Monthly Profit Margin
Per-event profit minus your fixed monthly costs: commissary rent, insurance, loan payments, phone, subscriptions.
Healthy range: 20-35%
Monthly margin is lower than per-event margin because fixed costs eat into profit during slow months when you have fewer events.
Annual Profit Margin
Your total yearly revenue minus every cost the business incurs, including truck maintenance, permit renewals, equipment replacement, and taxes.
Healthy range: 15-30%
Annual margin is the most honest number, but operators rarely calculate it in real time. Build the habit of tracking monthly, and annual takes care of itself.
The Cost Breakdown: Where Your Money Goes
Here is how a typical food truck event breaks down for a truck generating $2,000 in revenue.
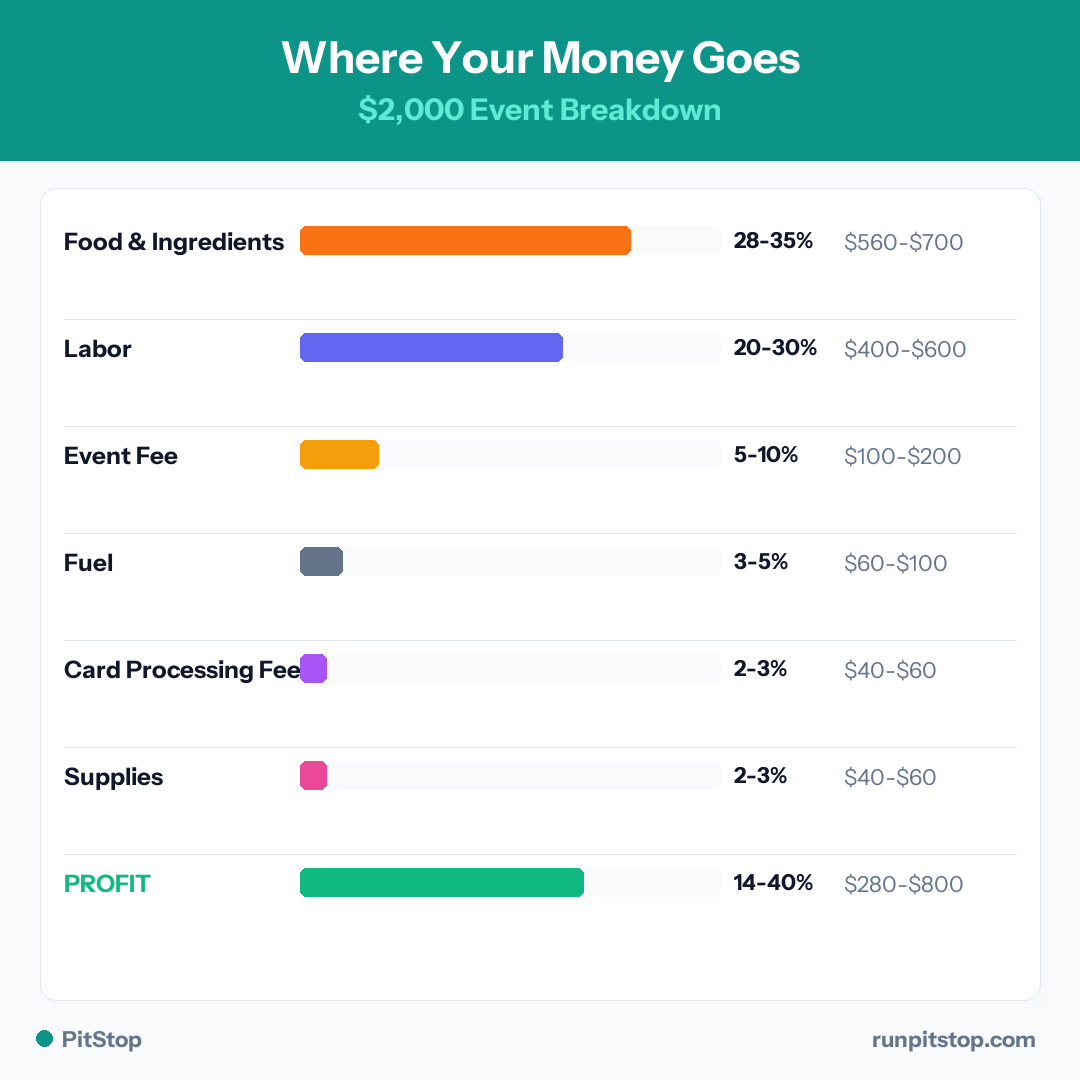
| Cost Category | % of Revenue | Dollar Amount |
|---|---|---|
| Food and ingredients | 30-35% | $600 - $700 |
| Labor | 20-30% | $400 - $600 |
| Event/venue fee | 5-10% | $100 - $200 |
| Fuel and transport | 3-5% | $60 - $100 |
| Credit card processing | 2-3% | $40 - $60 |
| Disposables and supplies | 2-3% | $40 - $60 |
| Total direct costs | 60-86% | $1,200 - $1,720 |
| Per-event profit | 14-40% | $280 - $800 |
The spread between a bad event ($280 profit) and a great event ($800 profit) on the same $2,000 in revenue is almost entirely within your control.
Food Cost: The Number That Makes or Breaks You
Your food cost percentage is the single most important metric in your business. It is the ratio of ingredient costs to revenue.
Your next steps
Most operators tackle these right alongside the permit. Each takes a few minutes and gets you closer to opening day.
Finance your truck or equipment
Trucks run $30k to $175k. Compare equipment and working-capital options, with a soft check to start.
See financing optionsAffiliate partner. PitStop may earn a commission at no extra cost to you.
Form your LLC
Set up the LLC most operators file for liability protection. A few minutes, often under $100 plus state fees.
Start your LLCAffiliate partner. PitStop may earn a commission at no extra cost to you.
Some of these are affiliate partners, so PitStop may earn a commission at no extra cost to you. We only list options we would point a real operator to. How this works.
Benchmark: 30-35% of revenue
| Food Cost % | Revenue: $2,000 | Revenue: $3,000 |
|---|---|---|
| 25% | $500 | $750 |
| 28% | $560 | $840 |
| 30% | $600 | $900 |
| 33% | $660 | $990 |
| 35% | $700 | $1,050 |
| 40% | $800 | $1,200 |
Every percentage point matters. On $300,000 annual revenue, the difference between 30% and 35% food cost is $15,000 per year straight to your bottom line.
How to Control Food Cost
Price your menu correctly. Every item should have a food cost target. Tacos with $1.50 in ingredients need to sell for at least $5 (30% food cost). If your ingredients cost $3, you need to charge $9-$10.
Are your events actually profitable?
Log every event, track real costs, and see your actual profit per gig so you stop guessing and start booking smarter. Free to start.
Track waste. Most food trucks lose 5-10% of their inventory to waste, spoilage, and overportioning. That is money in the trash. Prep only what you need based on expected attendance.
Portion control. Use scales, scoops, and portioning tools. The difference between a 4oz and 5oz protein portion, across 100 servings, is 6+ extra pounds of product per event.
Negotiate with suppliers. Buy in volume where possible. Build relationships with 2-3 suppliers and get quotes regularly. Even small discounts (5-10%) on your top ingredients add up.
Menu engineer ruthlessly. Know the food cost and profit margin on every item. Push high-margin items. Consider dropping low-margin items that do not drive traffic. Run the numbers in the PitStop Calculator before making menu changes.
Labor: The Second Biggest Cost
Benchmark: 20-30% of revenue
Labor math for food trucks is different from restaurants because many owners are the primary cook and server.
Solo Operator
If you run the truck alone, your "labor cost" is your personal income. There is no separate labor line - your profit IS your pay. This gives you the highest margins on paper (often 40-50% per event) but limits your capacity.
Owner Plus 1-2 Staff
The most common setup. You work the truck and hire 1-2 part-time employees at $13-$20/hour.
Example for a 6-hour event:
- 1 employee x 6 hours x $16/hour = $96
- Plus payroll taxes (~15%): $110 total labor cost
- On $1,500 revenue: 7.3% labor cost
With 2 employees: roughly $220, or 14.7% of $1,500 revenue. This is manageable and keeps margins healthy.
Full Crew (Owner Not Working the Line)
If you hire a full team and step back from daily operations, labor jumps to 25-35% of revenue. This is where margins start to compress and you need higher volume to compensate.
Event Fees: The Hidden Margin Killer
Event fees range from $0 (free parking spots, brewery partnerships) to $2,000+ (large festivals). Some events charge a flat fee. Others take a percentage of revenue (typically 10-20%). Some charge both.
The math you need to run before every event:
If a festival charges a $1,000 flat fee, you need at least $3,000 in revenue just to hit a 30% margin after food cost (assuming 33% food cost). That means you need to serve roughly 200-300 customers at $10-$15 average ticket.
Use the PitStop Calculator to model whether an event is worth it before you commit. Plug in the fee, your expected revenue, and your food cost to see projected profit.
Events to Avoid
- Any event where the fee exceeds 15% of your realistic revenue estimate
- "Exposure" events that promise traffic but have no proven track record
- Events with high fees AND mandatory operating hours (10+ hours)
- Events where you are one of 30+ food trucks competing for the same crowd
Food truck operators are discussing this
Lake Eola farmers market -- steady but not spectacular
Bilingual menus increased my average ticket by $3
Portland Saturday Market -- love/hate relationship
The Costs Nobody Tells You About
These are the expenses that do not show up on a per-event P&L but destroy annual margins.
Credit card processing fees: 2.5-3% of every transaction. On $300,000 annual revenue, that is $7,500-$9,000 you never see. Almost all food truck revenue is card-based now.
Fuel: $30-$80 per event depending on distance and generator usage. At 200 events per year, that is $6,000-$16,000.
Truck maintenance: Budget $3,000-$8,000 per year for maintenance and repairs. Generators, tires, brakes, plumbing, and cooking equipment all need service.
Permit renewals: $500-$2,000 per year depending on your city and how many jurisdictions you operate in.
Commissary: $200-$1,500 per month, regardless of how many events you work. This is a fixed cost that hits hard during slow months.
Propane: $30-$60 per fill, 1-2 fills per week during busy season. Annual: $1,500-$5,000.
Insurance: $2,000-$5,000 per year. Non-negotiable.
When you add these up, the gap between per-event margins (35-45%) and annual margins (15-30%) becomes clear. Fixed and semi-variable costs eat 10-15% of your gross revenue whether you have a great month or a terrible one.
Red Flags: When Your Margins Are Too Low
If your per-event profit margin is consistently below 15%, something is wrong. Here are the most common causes.
Food cost above 38%. Your menu is priced too low, your portions are too large, or you have a waste problem. Audit every menu item.
Labor above 30%. You are overstaffed for your volume, or your revenue per event is too low to support your crew size. Either increase revenue (higher prices, better events) or reduce labor.
Too many low-revenue events. If your average event brings in less than $800, you are spending more on fuel, setup time, and opportunity cost than the event is worth.
High event fees with low attendance. A $500 festival fee on a $1,200 revenue day leaves you with almost nothing after food and labor. Be selective.
Not tracking costs. This is the biggest red flag. If you do not know your food cost percentage, your labor percentage, or your per-event profit, you cannot improve your margins because you cannot see them.
How to Improve Your Margins
1. Raise Prices Strategically
Most food trucks underprice their menu. A $1-$2 increase on your top-selling items, spread across 100+ daily customers, adds $100-$200 per event to your top line with zero additional cost. Test small increases and watch whether volume changes. In most cases, it does not.
2. Cut Your Bottom 3 Menu Items
Every menu has items that sell poorly and have bad margins. Identify the bottom 3 by profit contribution and remove them. Fewer items means less inventory, less waste, faster service, and better margins.
3. Be Ruthless About Event Selection
Track profit per event in PitStop. After 20-30 events, you will have clear data on which events, locations, and event types deliver the best margins. Do more of those. Drop the rest.
4. Reduce Waste to Under 5%
Prep based on data, not gut feeling. Track how much you prep vs. how much you sell at each event. Adjust quantities until waste is below 5% of food purchases.
5. Optimize Your Operating Schedule
Working 6-7 days a week does not mean higher profit if those extra days are low-revenue events. Three strong events at $2,500 revenue and 40% margins ($3,000 profit) beat five mediocre events at $1,000 revenue and 25% margins ($1,250 profit).
6. Add High-Margin Upsells
Drinks (especially canned beverages) carry 60-80% margins. Sides with low food cost (rice, beans, chips) add $3-$5 per ticket at minimal cost. Desserts with high perceived value and low ingredient cost (churros, cookies) boost average ticket by 15-25%.
Track Your Margins or Guess
The difference between food truck operators earning $50,000 and those earning $100,000+ is rarely talent or menu quality. It is whether they know their numbers.
Every event you work generates data: revenue, food cost, labor, fees, profit. That data tells you exactly which events, menu items, and operating decisions make you money and which cost you money.
Stop guessing. Start tracking.
PitStop calculates your profit margin on every event automatically. Log your revenue and costs, and see your per-event margin, monthly trends, and annual profitability in real time. Free for 10 events per month.