The US Food Truck Industry at a Glance
The narrow food truck industry is roughly a $2-3 billion market in the US (IBISWorld reports about $2.8 billion for 2025) and growing. There are tens of thousands of food trucks operating nationwide, though the exact count depends on definition (employer businesses, sole proprietors, and all mobile vendors each give a different number). And how big the "industry" looks depends entirely on how you measure it: narrow value-added revenue lands around $2-3 billion, while gross-sales estimates (trucks times average revenue) run far higher - industry advocates such as the NSFVA put it at $14-20 billion. These are the numbers that matter if you are thinking about entering the industry - or already in it and wondering where you stand.
Most-Quoted 2026 Numbers
| Metric | 2026 Value |
|---|---|
| Food truck industry size (narrow) | ~$2.8 billion (IBISWorld, 2025) |
| Active food trucks nationwide | 36,000-40,000 (estimates vary) |
| Annual industry growth rate | 6-8% |
| Median annual truck revenue | $350,000 |
| Average ticket price | $13 |
| State with most trucks | California (~5,200) |
| Highest per-capita density | Oregon (38.1 per 100,000) |
| 3-year survival rate | ~60% |
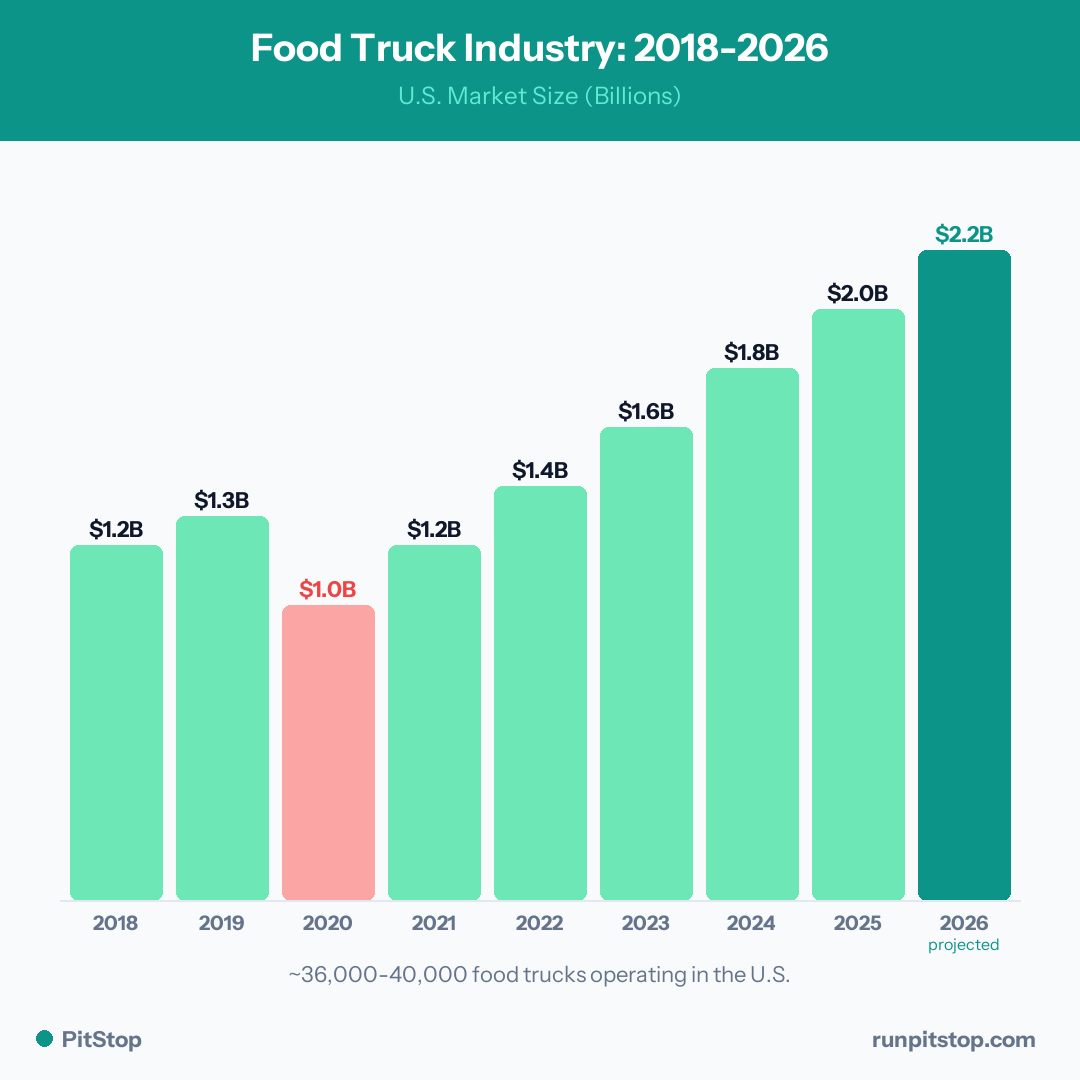
Industry Growth: 2018-2026
| Year | Market Size (US) | Annual Growth | Estimated Truck Count |
|---|---|---|---|
| 2018 | $1.2 billion | 7.3% | 27,000 |
| 2019 | $1.3 billion | 7.5% | 29,000 |
| 2020 | $1.0 billion | -22.8% | 24,000 |
| 2021 | $1.2 billion | 18.5% | 27,500 |
| 2022 | $1.5 billion | 20.1% | 31,000 |
| 2023 | $1.7 billion | 13.3% | 33,500 |
| 2024 | $1.9 billion | 8.2% | 35,500 |
| 2025 | $2.1 billion | 7.1% | 37,500 |
| 2026 (est.) | $2.2 billion | 6.5% | 39,000 |
These are PitStop modeled estimates of the narrow food-truck industry and run conservative: published sources put it higher (IBISWorld reports about $2.8 billion for 2025), and gross-sales estimates that multiply trucks by average revenue run far higher still (the NSFVA estimates $14-20 billion). Counts and revenue both vary by source and definition, so treat the table as a directional trend, not a precise tally.
The 2020 dip was severe - nearly a quarter of industry revenue vanished when events, festivals, and office lunches shut down. The recovery since has been stronger than restaurants overall, driven by lower overhead and the flexibility to chase demand wherever it moves.
Average Food Truck Revenue
| Metric | Range | Median |
|---|---|---|
| Annual revenue | $250,000 - $500,000 | $350,000 |
| Monthly revenue (peak season) | $25,000 - $50,000 | $35,000 |
| Monthly revenue (off season) | $10,000 - $25,000 | $15,000 |
| Daily revenue (event day) | $400 - $3,000+ | $1,200 |
| Average ticket price | $10 - $16 | $13 |
These numbers represent trucks that have been operating for 2+ years and run at least 12 events per month. First-year trucks typically earn 40-60% of these figures while building their customer base and refining operations.
Survival and Success Rates
| Metric | Food Trucks | Restaurants |
|---|---|---|
| Survive 1 year | 80% | 70% |
| Survive 3 years | 60% | 40% |
| Survive 5 years | 45% | 30% |
| Average startup cost | $50K - $200K | $250K - $750K |
| Breakeven timeline | 12 - 24 months | 18 - 36 months |
Food trucks have a significantly higher survival rate than restaurants. The reasons are structural: lower startup costs, lower fixed overhead, the ability to move to better locations, and the option to scale down hours during slow periods instead of carrying the full weight of a lease.
Your next steps
Most operators tackle these right alongside the permit. Each takes a few minutes and gets you closer to opening day.
Finance your truck or equipment
Trucks run $30k to $175k. Compare equipment and working-capital options, with a soft check to start.
See financing optionsAffiliate partner. PitStop may earn a commission at no extra cost to you.
Form your LLC
Set up the LLC most operators file for liability protection. A few minutes, often under $100 plus state fees.
Start your LLCAffiliate partner. PitStop may earn a commission at no extra cost to you.
Some of these are affiliate partners, so PitStop may earn a commission at no extra cost to you. We only list options we would point a real operator to. How this works.
The 40% that fail within three years share common traits: undercapitalization, poor location strategy, inconsistent operations, and failure to track their numbers.
Food Trucks by State (Top 10)
Are your events actually profitable?
Log every event, track real costs, and see your actual profit per gig so you stop guessing and start booking smarter. Free to start.
| Rank | State | Estimated Truck Count | Trucks per 100K Residents |
|---|---|---|---|
| 1 | California | 5,200 | 13.3 |
| 2 | Texas | 4,100 | 13.6 |
| 3 | Florida | 3,400 | 15.0 |
| 4 | New York | 2,800 | 14.3 |
| 5 | Oregon | 1,600 | 38.1 |
| 6 | Washington | 1,400 | 18.0 |
| 7 | Colorado | 1,200 | 20.3 |
| 8 | Georgia | 1,100 | 10.1 |
| 9 | North Carolina | 1,000 | 9.4 |
| 10 | Arizona | 950 | 12.9 |
Oregon and Colorado punch well above their weight on a per-capita basis. Portland alone has an estimated 500+ food carts and trucks. States with year-round warm weather (Florida, Texas, Arizona) and large metro areas naturally support more trucks.
Most Profitable Cuisine Types
| Cuisine | Avg Food Cost % | Avg Ticket | Margin Potential | Notes |
|---|---|---|---|---|
| BBQ / smoked meats | 28 - 32% | $14 - $18 | High | High ticket, but slow cook time |
| Tacos / Mexican | 25 - 30% | $10 - $14 | High | Low food cost, fast service |
| Burgers / American | 30 - 35% | $12 - $16 | Medium-High | Solid demand everywhere |
| Coffee / beverages | 15 - 22% | $5 - $8 | Very High (per item) | Low ticket but massive margins |
| Desserts / ice cream | 20 - 28% | $6 - $10 | High | Seasonal in cold climates |
| Asian fusion | 25 - 30% | $12 - $16 | High | Trending upward in demand |
| Pizza | 28 - 33% | $10 - $14 | Medium-High | Requires specialized equipment |
The highest-margin items are beverages and desserts. The highest-revenue items are BBQ and premium burgers. The best operators combine both - a high-ticket main item with a high-margin drink or side that pushes the average ticket up.
Industry Trends Shaping 2026
Catering Is the Growth Engine
Food trucks are increasingly pivoting from street vending to private catering. Corporate events, weddings, and private parties pay $1,500-$5,000+ per event with guaranteed minimums. The most profitable trucks derive 30-50% of revenue from catering.
Ghost Kitchens and Delivery
Some food truck operators are adding delivery through DoorDash, Uber Eats, and Grubhub - either from their truck or from a ghost kitchen. This adds a revenue stream on non-event days but comes with 15-30% commission fees that compress margins.
Food Halls
Permanent food hall stalls give truck operators a fixed location with lower overhead than a restaurant. Many operators run both a truck and a food hall stall for maximum coverage.
Technology Adoption
Food truck operators are discussing this
Lake Eola farmers market -- steady but not spectacular
Bilingual menus increased my average ticket by $3
Portland Saturday Market -- love/hate relationship
POS systems, online ordering, social media marketing, and business tracking tools are becoming standard. Operators who run their business on paper are at a measurable disadvantage in efficiency and decision-making.
Consumer Trends
| Metric | Value |
|---|---|
| Americans who buy from food trucks monthly | 35% |
| Average spend per food truck visit | $12 - $15 |
| Consumers who discover food trucks via social media | 47% |
| Consumers who prefer food trucks over fast food | 28% |
| Consumers willing to travel 15+ minutes for a food truck | 22% |
Social media is the number one discovery channel for food trucks. Nearly half of food truck customers find new trucks through Instagram, TikTok, or Facebook. Operators who post consistently drive measurably more traffic than those who do not.
Employment Data
| Metric | Value |
|---|---|
| Average employees per truck | 2.5 - 4 |
| Total industry employment (US) | 120,000 - 160,000 |
| Average hourly wage (all positions) | $13 - $17 |
| Owner annual income (established truck) | $50,000 - $120,000 |
| Owner annual income (first year) | $20,000 - $50,000 |
Most food trucks operate with 2-3 employees plus the owner. Scaling beyond 4 employees typically means the truck is doing $30,000+/month in revenue and operating 15+ events per month.
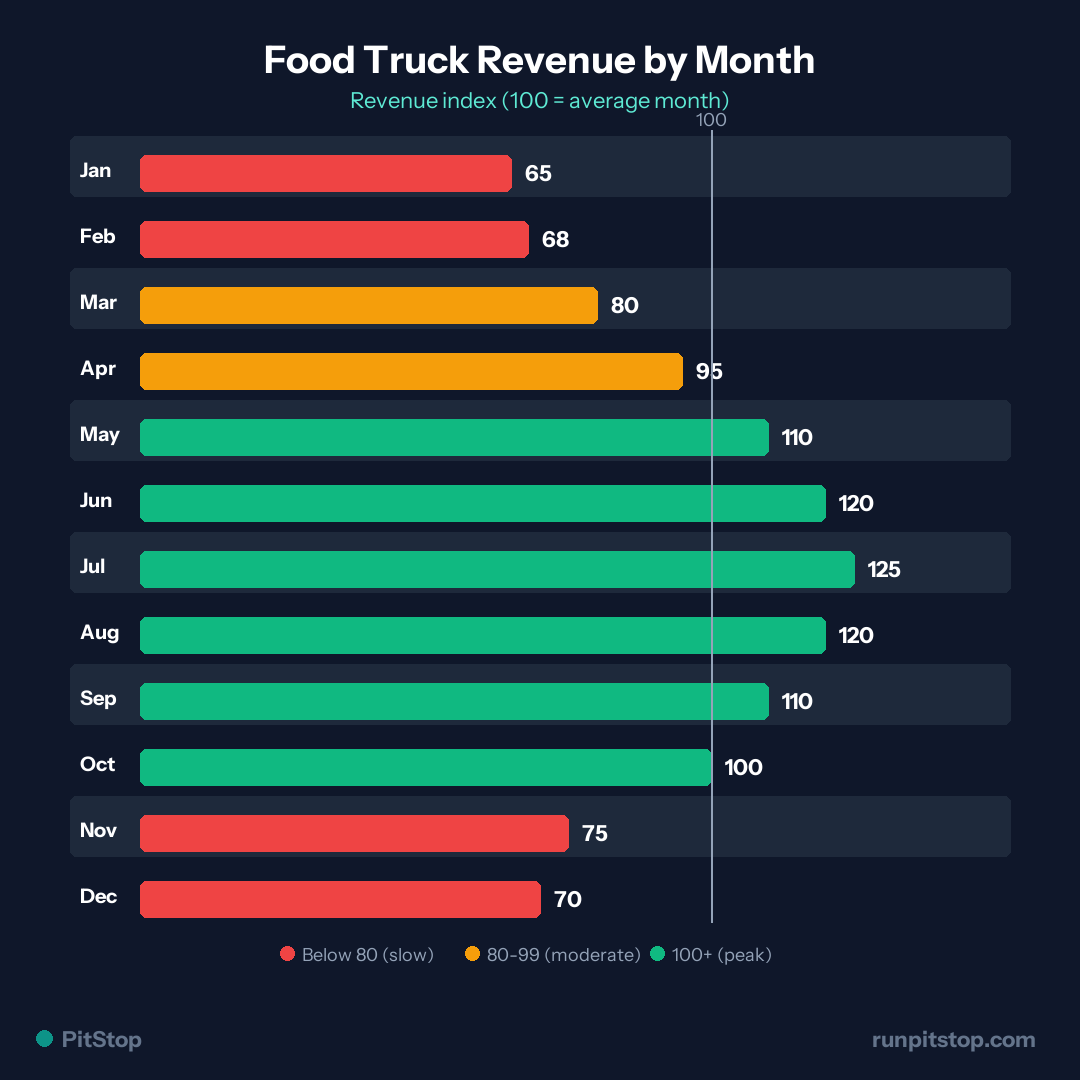
Seasonality: Revenue by Month
| Month | Revenue Index (100 = annual average) |
|---|---|
| January | 65 |
| February | 70 |
| March | 85 |
| April | 95 |
| May | 110 |
| June | 120 |
| July | 125 |
| August | 120 |
| September | 110 |
| October | 105 |
| November | 80 |
| December | 75 |
Summer months (May-August) generate 25-30% more revenue than the annual average. Winter months (November-February) drop 20-35% below average. Smart operators build cash reserves during peak months to cover winter slowdowns and plan their maintenance and vacations for the slow period.
What These Numbers Mean for You
Statistics are useful only if you apply them. Here is what to take from this data:
Use the PitStop Food Truck Calculator to see how your projected revenue stacks up against industry benchmarks. Then track your actual performance event by event.
Be on the right side of the statistics by tracking your numbers with PitStop - free for 10 events/month.