Festival Revenue Ranges: $1,000 to $15,000+ Per Event
Festivals are the highest-revenue events most food trucks will work. A strong weekend festival can generate more revenue than two weeks of lunch service. But they also carry the highest risk - fees, weather, competition, and logistics can turn a $10,000 weekend into a $500 loss.
This guide covers real revenue ranges by festival size, the math behind evaluating festival profitability, and how to decide which events are worth your time and money.
Revenue by Festival Size
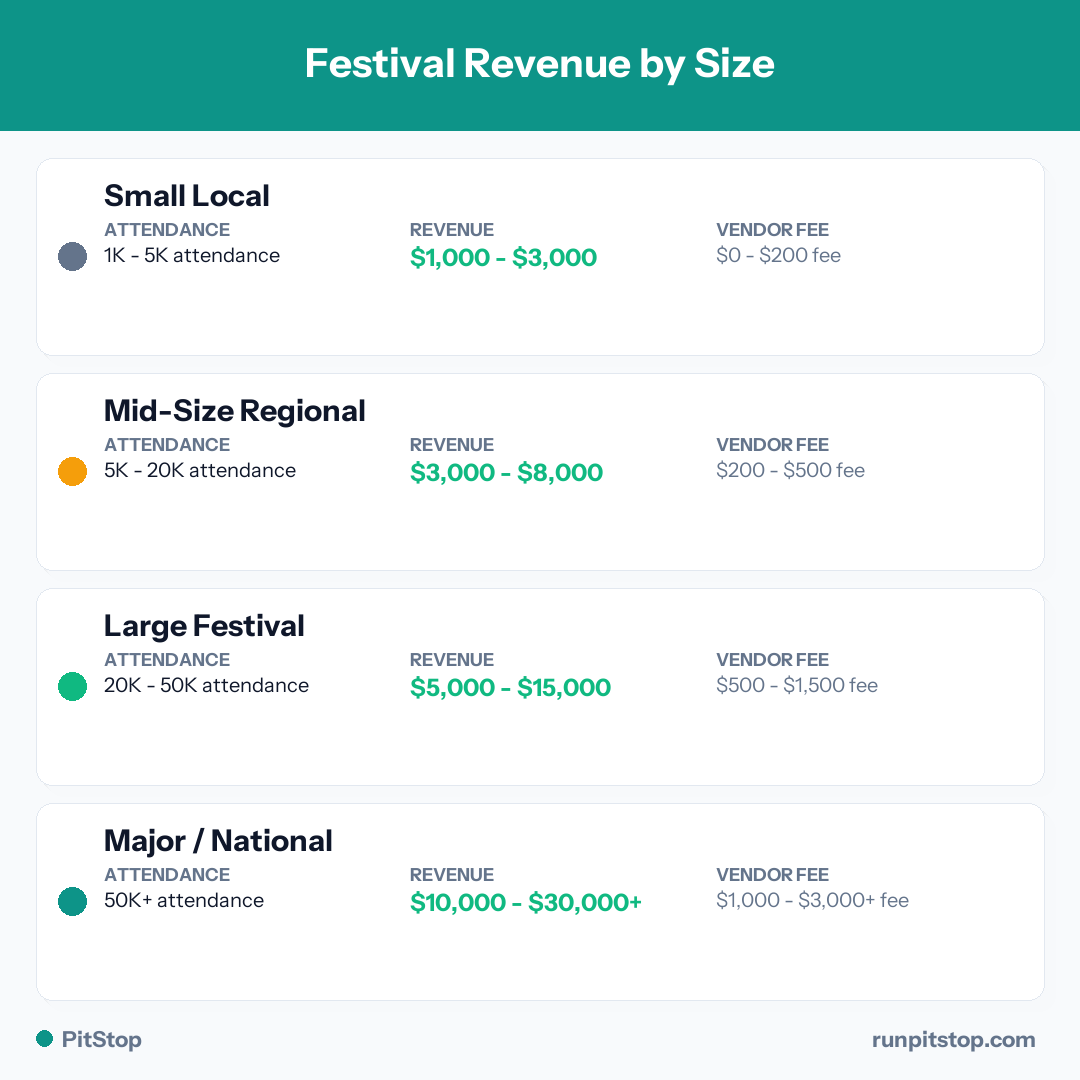
| Festival Type | Expected Attendance | Typical Revenue | Typical Fee | Estimated Net Profit |
|---|---|---|---|---|
| Small local (farmers market, block party) | 500 - 2,000 | $1,000 - $3,000 | $50 - $200 | $400 - $1,500 |
| Mid-size community (county fair, food fest) | 2,000 - 10,000 | $3,000 - $8,000 | $200 - $1,000 | $1,200 - $4,000 |
| Large regional (music fest, multi-day) | 10,000 - 50,000 | $5,000 - $15,000 | $500 - $3,000 | $2,000 - $8,000 |
| Major/national (state fair, signature events) | 50,000+ | $10,000 - $30,000+ | $1,000 - $5,000+ | $4,000 - $15,000+ |
These are gross revenue figures. Your actual profit depends on food cost (30-35%), labor, fuel, and the event fee itself.
The Festival Profitability Formula
Before committing to any festival, run this math.
Estimated Profit = Estimated Revenue - Food Cost - Labor - Event Fee - Fuel/Travel - Supplies
Here is a worked example for a mid-size festival:
Your next steps
Most operators tackle these right alongside the permit. Each takes a few minutes and gets you closer to opening day.
Need a Certificate of Insurance?
Most markets and events ask for a COI before they let you book. Get one you can send organizers the same day.
Get your COIAffiliate partner. PitStop may earn a commission at no extra cost to you.
Form your LLC
Set up the LLC most operators file for liability protection. A few minutes, often under $100 plus state fees.
Start your LLCAffiliate partner. PitStop may earn a commission at no extra cost to you.
Some of these are affiliate partners, so PitStop may earn a commission at no extra cost to you. We only list options we would point a real operator to. How this works.
| Line Item | Amount |
|---|---|
| Estimated revenue (2 days) | $6,000 |
| Food cost (30%) | -$1,800 |
| Labor (2 staff x 12hrs x 2 days x $15/hr) | -$720 |
| Event fee | -$500 |
| Fuel (round trip + generator) | -$150 |
| Supplies/disposables | -$200 |
| Net profit | $2,630 |
| Profit margin | 43.8% |
That is a good event. Now here is what happens when the numbers shift slightly:
Are your events actually profitable?
Log every event, track real costs, and see your actual profit per gig so you stop guessing and start booking smarter. Free to start.
| Scenario | Revenue | Net Profit | Margin |
|---|---|---|---|
| Strong weekend | $8,000 | $4,310 | 53.9% |
| Average weekend | $6,000 | $2,630 | 43.8% |
| Weak weekend (rain, low turnout) | $2,500 | $130 | 5.2% |
| Washout (bad weather, oversaturated) | $1,200 | -$870 | -72.5% |
One bad festival will not sink you. But three or four bad festivals in a season - especially if the fees were high - can erase your profit for the entire quarter.
What Kills Festival Profit
1. Fees That Eat Your Margin
Some festivals charge a flat fee plus a percentage of sales (10-20%). A $1,000 fee plus 15% of gross on a $5,000 weekend costs you $1,750 in fees alone - 35% of revenue before you buy a single ingredient. Always know the full fee structure before signing up.
2. Too Many Trucks
If a festival books 30 food trucks for 5,000 attendees, you are competing for $166 per attendee across 30 vendors. If they book 10 trucks, you are competing for $500 per attendee across 10 vendors. Always ask how many trucks will be there.
3. Wrong Menu for the Event
A $15 gourmet bowl does not sell at a family-friendly county fair where attendees expect $8-$10 meals. A basic hot dog setup gets passed over at a foodie festival. Match your menu and pricing to the audience.
4. Weather
Food truck operators are discussing this
Lake Eola farmers market -- steady but not spectacular
Bilingual menus increased my average ticket by $3
Portland Saturday Market -- love/hate relationship
You cannot control weather, but you can evaluate risk. A July outdoor festival in Florida has a 40%+ chance of afternoon thunderstorms. A November festival in the Midwest risks freezing temperatures. Factor weather into your revenue estimates - assume 30-50% less revenue on rain days.
5. Poor Logistics
Long drive times, no generator hookup, bad placement within the festival grounds, and limited setup time all cost you money. A 3-hour drive each way at $0.80/mile plus a hotel room adds $400+ to your costs before you sell anything.
How to Evaluate a Festival Before Committing
Ask these questions before signing up:
| Question | Red Flag | Green Flag |
|---|---|---|
| How many food trucks? | 20+ for under 5,000 attendees | Under 15 for 5,000+ attendees |
| Fee structure? | Flat fee + percentage of sales | Flat fee only, under $500 |
| Attendance last year? | "We expect a good turnout" | Specific number with data |
| Is there a truck cap on similar menus? | No, anyone can apply | Yes, limited to 1-2 per cuisine |
| Power/generator hookup? | You must bring your own for a 3-day event | Power provided or generator okay |
| Location of your spot? | Assigned at random day-of | You can choose or spots are pre-assigned on a map |
| Cancellation/refund policy? | No refunds for any reason | Partial refund for weather cancellation |
If the organizer cannot answer these questions with specifics, that tells you something.
Best Festival Months by Region
| Region | Peak Months | Notes |
|---|---|---|
| Southeast (FL, GA, SC, NC) | Oct - Apr | Avoid summer heat and hurricane season |
| Northeast (NY, NJ, PA, MA) | May - Sep | Short but intense season |
| Midwest (OH, IL, MI, MN) | Jun - Sep | County fairs peak in July-August |
| Southwest (TX, AZ, NM) | Mar - May, Sep - Nov | Avoid July-August extreme heat |
| West Coast (CA, OR, WA) | Apr - Oct | Year-round in SoCal |
| Mountain (CO, UT) | Jun - Sep | Altitude = cooler temps, shorter season |
Plan your festival calendar around your region's peak months. Off-season festivals typically generate 30-50% less revenue.
Track Every Festival or Repeat Your Mistakes
The difference between a food truck that earns $80,000 at festivals and one that earns $40,000 is not luck. It is data. When you track revenue, costs, and profit for every single event, you can see exactly which festivals are worth repeating and which are a waste of your weekend.
Use the PitStop Food Truck Calculator to estimate festival profitability before you commit. Then log the actual results after each event to build a data-driven festival strategy.
PitStop tracks your per-event profit automatically. Free for 10 events per month.