The Range: $400 to $3,000+ Per Day
That is a wide range, and it is real. A slow Tuesday lunch spot in a suburban office park might net you $400. A Saturday music festival with 10,000 attendees can push $3,000 or more. The difference comes down to three things: event type, average ticket price, and customer count.
This guide breaks down exactly what determines your daily revenue and how to move from the low end to the high end.
Daily Revenue by Event Type
| Event Type | Typical Customer Count | Avg Ticket | Daily Revenue Range | Frequency |
|---|---|---|---|---|
| Weekday lunch spot | 50 - 120 | $10 - $14 | $500 - $1,680 | 3-5x/week |
| Farmers market | 60 - 150 | $10 - $16 | $600 - $2,400 | 1-2x/week |
| Brewery / taproom night | 40 - 100 | $12 - $16 | $480 - $1,600 | 1-3x/week |
| Private catering event | 50 - 200 | $15 - $25 | $750 - $5,000 | 1-4x/month |
| Festival / fair (per day) | 150 - 500+ | $12 - $18 | $1,800 - $9,000+ | 2-6x/month |
| Corporate lunch | 80 - 200 | $12 - $16 | $960 - $3,200 | 1-4x/month |
The highest-grossing days come from festivals and catering. The most consistent days come from recurring lunch spots and brewery nights. A strong business has a mix of both.
The Math That Matters
Daily revenue is simple multiplication:
Average Ticket Price x Number of Customers = Daily Revenue
Here is what that looks like across different combinations.
Your next steps
Most operators tackle these right alongside the permit. Each takes a few minutes and gets you closer to opening day.
Finance your truck or equipment
Trucks run $30k to $175k. Compare equipment and working-capital options, with a soft check to start.
See financing optionsAffiliate partner. PitStop may earn a commission at no extra cost to you.
Form your LLC
Set up the LLC most operators file for liability protection. A few minutes, often under $100 plus state fees.
Start your LLCAffiliate partner. PitStop may earn a commission at no extra cost to you.
Some of these are affiliate partners, so PitStop may earn a commission at no extra cost to you. We only list options we would point a real operator to. How this works.
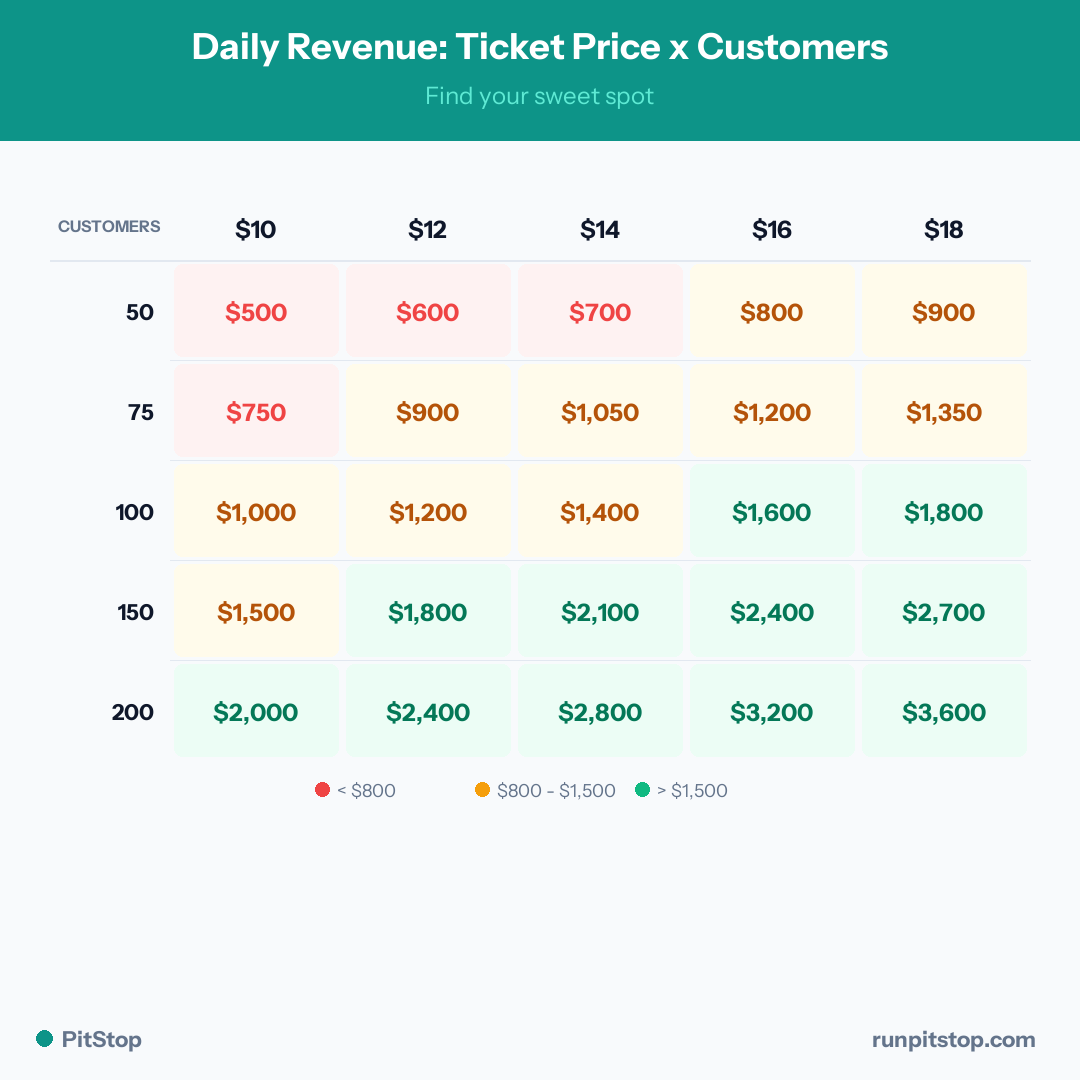
| 50 Customers | 75 Customers | 100 Customers | 150 Customers | 200 Customers | |
|---|---|---|---|---|---|
| $10 avg ticket | $500 | $750 | $1,000 | $1,500 | $2,000 |
| $12 avg ticket | $600 | $900 | $1,200 | $1,800 | $2,400 |
| $14 avg ticket | $700 | $1,050 | $1,400 | $2,100 | $2,800 |
| $16 avg ticket | $800 | $1,200 | $1,600 | $2,400 | $3,200 |
| $18 avg ticket | $900 | $1,350 | $1,800 | $2,700 | $3,600 |
Study this table. Every dollar you add to your average ticket at the same customer count is free revenue. Upselling drinks, sides, and combos is the fastest way to increase daily revenue without finding more customers.
Are your events actually profitable?
Log every event, track real costs, and see your actual profit per gig so you stop guessing and start booking smarter. Free to start.
Good Day vs Bad Day
What separates a $500 day from a $2,500 day? It is rarely just luck.
$500 Day (Bad)
- Weekday lunch spot with low foot traffic
- No social media post or pre-event marketing
- Weather kept people indoors
- Menu not optimized for speed - long ticket times reduced throughput
- Location had poor visibility from the road
$2,500 Day (Good)
- Weekend event with built-in crowd (festival, market, brewery)
- Posted location on social media 24 hours in advance
- Combo pricing pushed average ticket to $15+
- Prep was dialed in - served 150+ customers in 4 hours
- Repeat location where regulars know to find you
The pattern is clear: good days are engineered, not random. Location selection, pre-event marketing, menu pricing, and speed of service are all within your control.
Daily Costs: What Each Day Costs Before You Earn a Dollar
Food truck operators are discussing this
Lake Eola farmers market -- steady but not spectacular
Bilingual menus increased my average ticket by $3
Portland Saturday Market -- love/hate relationship
Every day you operate has a baseline cost regardless of revenue.
| Cost Category | Daily Range | Notes |
|---|---|---|
| Food / COGS (30-35% of revenue) | Variable | Scales with sales |
| Fuel (truck + generator) | $30 - $75 | Depends on distance and generator runtime |
| Propane | $10 - $25 | Depends on cooking volume |
| Commissary (daily share) | $15 - $40 | Monthly fee divided by operating days |
| Insurance (daily share) | $10 - $20 | Annual premium divided by operating days |
| Event/spot fee | $0 - $200 | Some locations charge rent or percentage |
| Disposables (plates, napkins, utensils) | $20 - $60 | Scales somewhat with volume |
| Staff (if applicable) | $100 - $400 | Depends on crew size and hours |
Fixed daily overhead (before food cost): $150 - $400. This is your daily nut. You need to clear this before you make a dollar of profit. On a $1,200 revenue day with $360 in food cost (30%) and $250 in fixed daily costs, your profit is $590. On a $500 revenue day with $150 in food cost and the same $250 in fixed costs, your profit is $100.
How Many Good Days Do You Need Per Month?
Here is the breakeven math.
| Monthly Fixed Costs | Daily Profit Needed | Good Days Needed (at $400 profit/day) | Good Days Needed (at $700 profit/day) |
|---|---|---|---|
| $3,000 | $3,000 | 8 days | 5 days |
| $5,000 | $5,000 | 13 days | 8 days |
| $7,000 | $7,000 | 18 days | 10 days |
| $10,000 | $10,000 | 25 days | 15 days |
Monthly fixed costs include your truck payment, insurance, commissary, permits, phone, software, and any other expenses that hit whether you operate or not. If your monthly nut is $5,000 and you average $700 profit per operating day, you need 8 good days per month to break even. Everything after that is income.
The Daily Tracking Habit
The operators who succeed track every single day. Not weekly. Not monthly. Daily. After every event, log three numbers:
After 30 days, you know your real daily average. After 90 days, you know which event types, days of week, and locations produce the best returns. This data is worth more than any business plan because it is your actual performance, not projections.
Use the PitStop Food Truck Calculator to set your daily revenue targets before you launch. Then log every event in PitStop to see exactly how you are tracking against those targets.
Track every day with PitStop - free for 10 events/month.